
OUTREACH DETAILS REPORT
The Outreach Details report provides the data related specifically to each outreach. This report provides the following information within a selected date range:
- Tracking Result
- First Time Households (new to your agency)
- Repeat Households (have visited before)
- Total Combined Households (new and have visited before)
- Speaks English
- Speaks Other
- Nationality/Race Numbers
- Age Group Numbers
This report automatically breaks down and displays each individual outreach within the date range selected. It automatically displays ALL tracking types – USDA Food, Bread and Produce, etc. – whatever your agency is tracking.
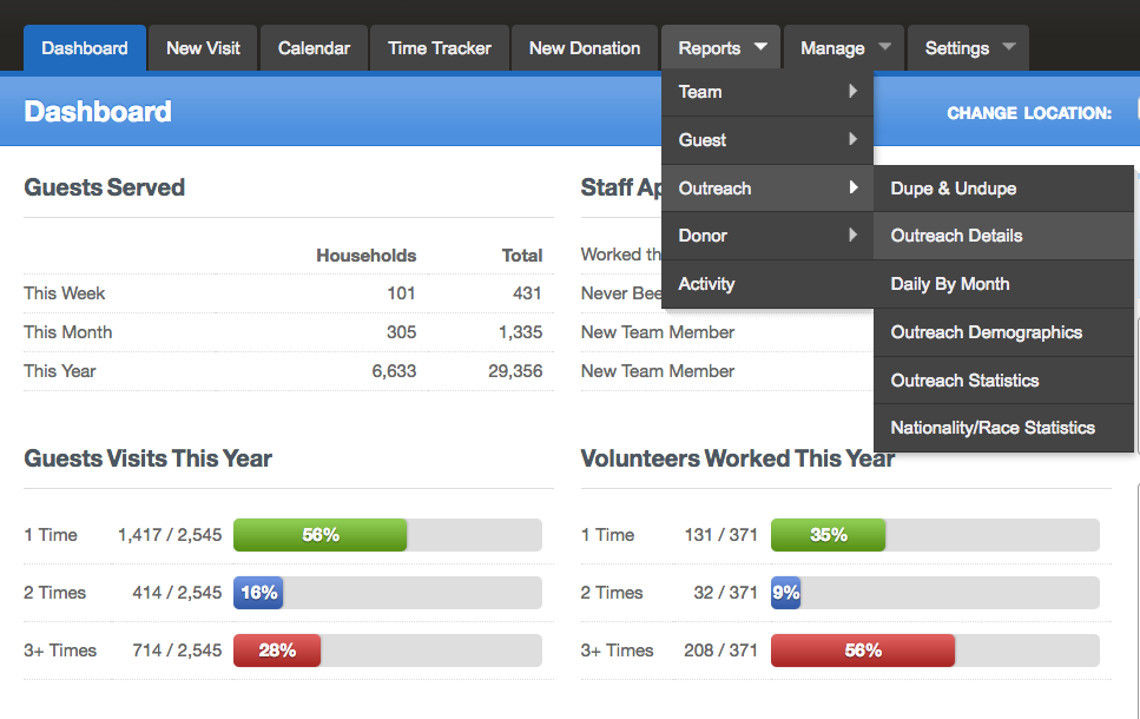
To open this report select the "Reports" tab at the top of the dashboard screen. Drag your curser down to the "Outreach" menu item. This will open a submenu showing the different outreach reports available. Drag your curser to the submenu item “Outreach Details" - click it.
To configure the report, enter in the date ranges for the selection of data you want for this report. To do this, click in the "From" date box and using the date picker choose the starting date for this report. Follow the same procedure to set the "To" date or the last date you want the data selection to contain.
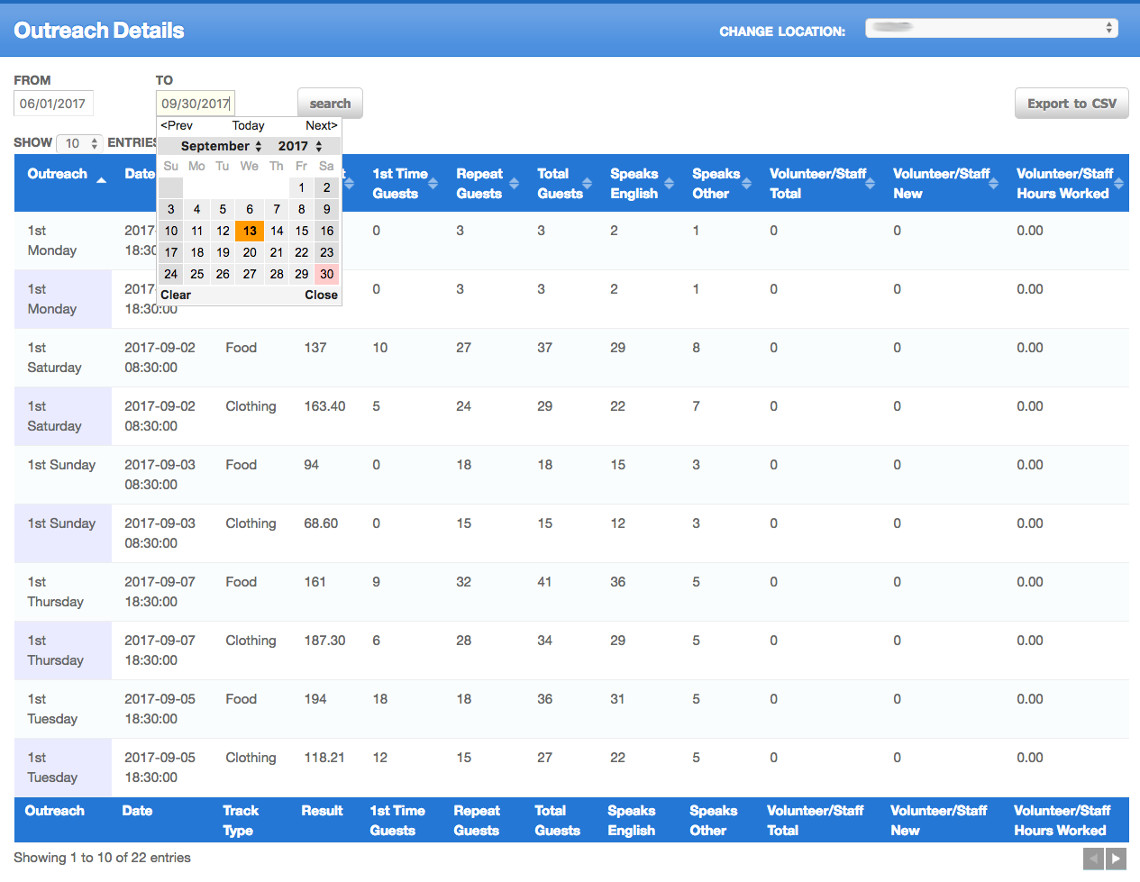
Now that your report is configured for the data you requested, click on the "Search" button. This will show the numbers requested on the screen.
Not all of the numbers show on the screen, to see all of the data, you will need to export the report and view in Excel. To export the report click on the "Export to CSV" button, found at the top right hand side of the screen. Export the report to have a paper copy or to customize the data to your needs or place in another report format.
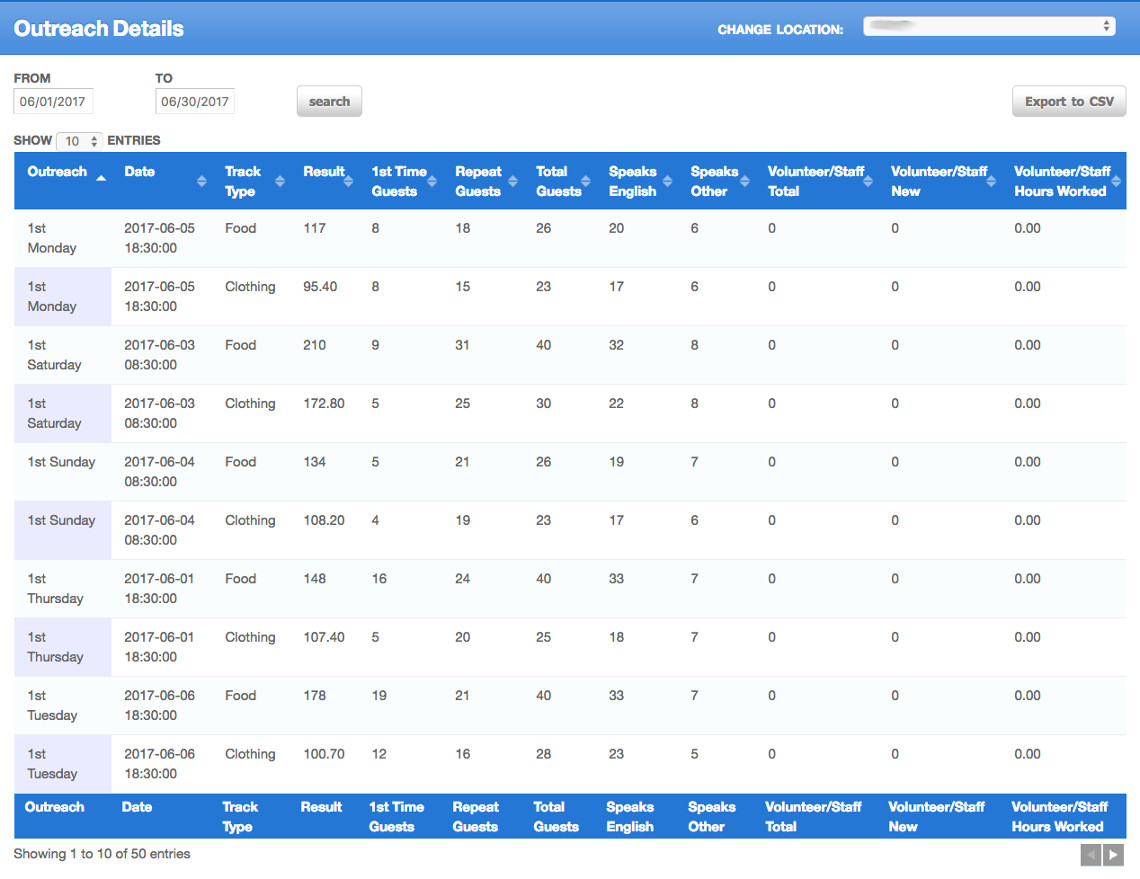
Understanding the Column Headers
It is important that you understand what the data means after you run the report. This becomes clear when you understand what each column means.
- Outreach: This column displays the name of the outreach. This agency has their outreaches named for the day of the week. Most agencies use the On-Demand outreaches and likely all outreaches would have the same name.
- Date: This column displays the day the outreach occured.
- Track Type: This column displays the goods and services (Help Desired) that was given during the outreach. One line per track type. In this example you see two lines, one for food and one for clothing for each outreach.
- Result: This column displays the totals calculated for the track type that this line is for. This pantry records "household totals" for food and "weight" for clothing.
- 1st Time Guests: This field is showing the number of new households that have visited your pantry that day for the first time ever. This is a "Household" number. We consider a guest the representative of the household. So 10 guests here would be 10 households.
- Repeat Guests: This field is showing the number of repeat household visits that visited your pantry that day but have come before as well. This is a "Household" number. We consider a guest the representative of the household. So 10 guests here would be 10 households.
- Total Guests: This field shows the total number of household visits that day. It adds the first time and repeat households together. This is a "Household" number. We consider a guest the representative of the household. So 10 guests here would be 10 households.
- The Nationality/Race Columns: What the report presents will depend on how you have setup your nationality/race field. Each of the columns represent one of the nationality/race options in your system. The value is a household number and represents the number of households that identify themselves as being a part of that nationality/race.
- The Age Group Columns: These columns represent the total number of people in the households that visited for that outreach and track type. This is an individual number. If you see 10, then there were 10 individuals that came that distribution that were in that age group.
Examples of How to Make Use of this Report:
This report is beneficial for viewing information around a specific outreach without having to enter a date range of one day.
Example
You suspect that you are serving more first time households during your agency’s Wednesday evening outreach. Use this report to compare specific days and collect an average vs other outreach days.
Get creative! Make your accurate data work for you and the people you serve!